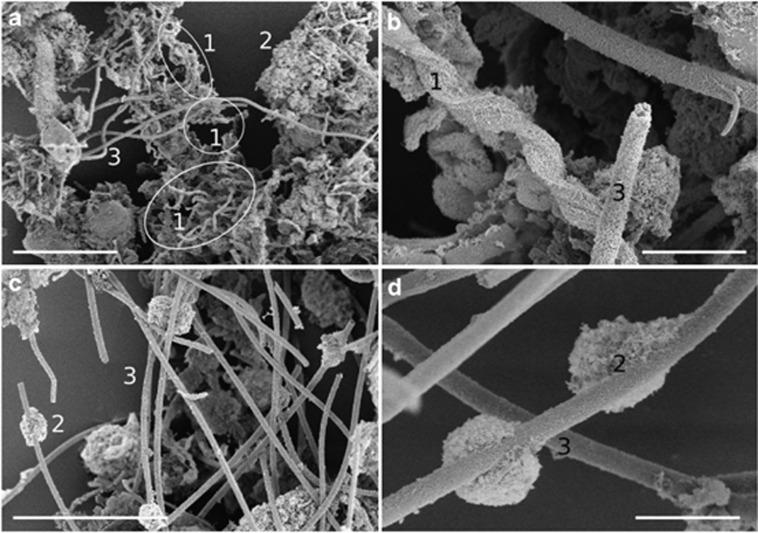
Figure 3.
Scanning electron micrographs of mats collected on 22 April (a, b) and mats collected on 1 June (c, d) with various stalk morphologies (1), disorganized iron-oxyhydroxide particulates (2) and sheaths (3). Scale bars for less magnified images (a, c) are 30 μm and those for magnified images are 5 μm (b, d).

