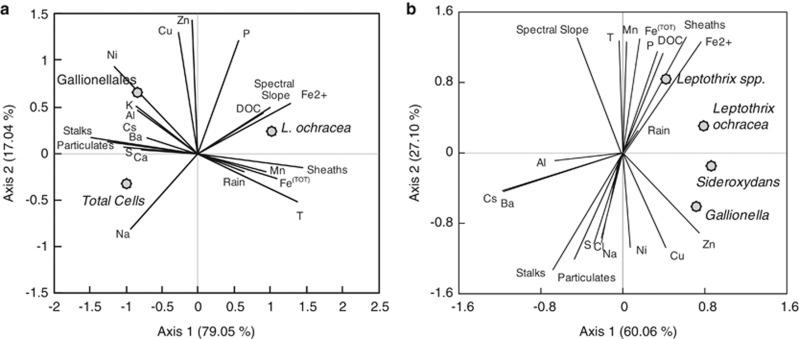
Figure 4.
Biplot of RDA of the total cells, total L. ochracea cells and Gallionellales cells from direct counts using FISH probes (a) or sequence read abundance of specific taxa from pyrosequencing (b; dots, response variables) with structural Fe(III)-oxyhydroxide morphotypes, major elements, DOC, air temperature, water temperature and spectral slope of DOC (vectors, explanatory).

