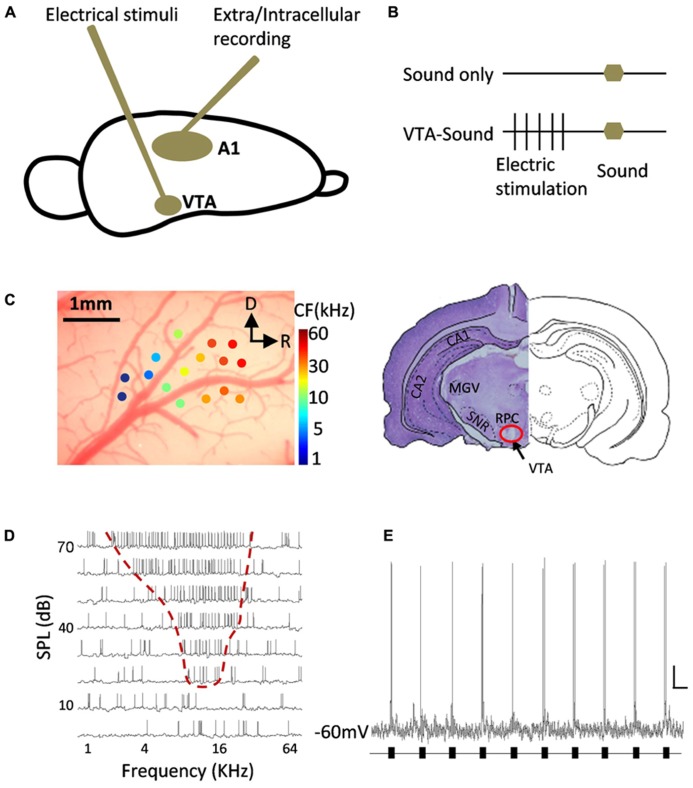
FIGURE 1.
Diagram of experiment design and example of neuronal responses in A1. (A) A tungsten electrode was inserted into midbrain to electrically stimulate VTA and metal electrodes/sharp glass pipettes were used to record neuronal responses in A1. (B) Two groups of stimulation protocols: sound only group (top) and paired VTA-sound group (see Materials and Methods for more details). (C) Localization of recording site in A1 and stimulation site in VTA. Extracellular multi-unit recording showed that neurons in A1 have typical gradient in CF from rostral to caudal direction. R, rostral; D, dorsal. The lesion at the stimulation site was well matched with the anatomical position of VTA from the results of cresyl violet staining (right). (D) An example of intracellular recording in A1 neuron showed typical “V” shaped frequency-intensity tonal receptive field. (E) An example of neuronal responses to repeated sound stimulation (black bars) in A1 recorded by in vivo intracellular recording. Scale bar: 10 mV/1s.

