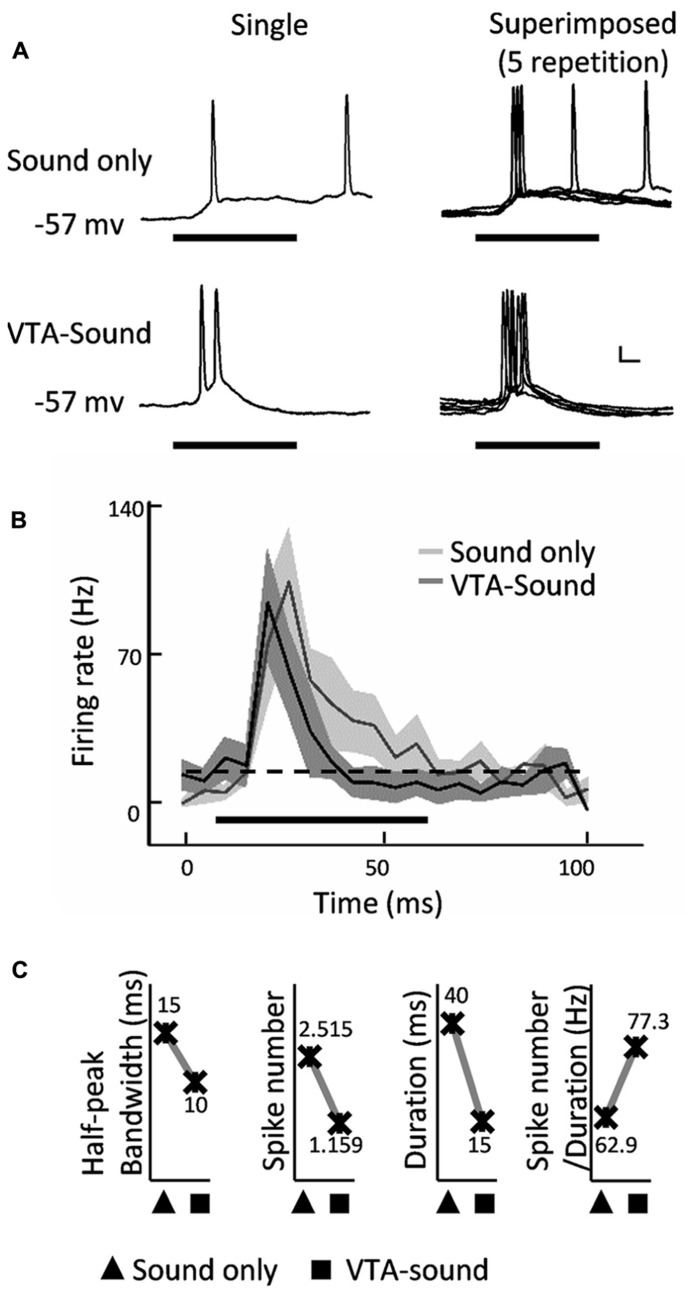
FIGURE 2.
Spiking response of A1 neurons was compressed by paired VTA-sound stimulation. (A) Example of an intracellular recording from a neuron in rat A1: top, sound only group; bottom, paired VTA-sound group; left, single trace of response; right, five superimposed traces. Thick black bar indicates the sound stimulation. Scale bar: 10 mV/10ms. (B) Averaged firing rate (mean ± S.D.) of neuronal responses evoked by two stimulation groups (n = 13). Shading indicates the SD. Sound only group: light gray; paired VTA-sound group: dark gray. 5 ms binning window. Dashed line showed the baseline of spontaneous firing. Thick black bar indicates the sound stimulation. (C) When VTA-sound stimuli were paired the half-peak bandwidth, spike number and duration of sound evoked spiking responses decreased except that the ratio between spike number and duration increased.

