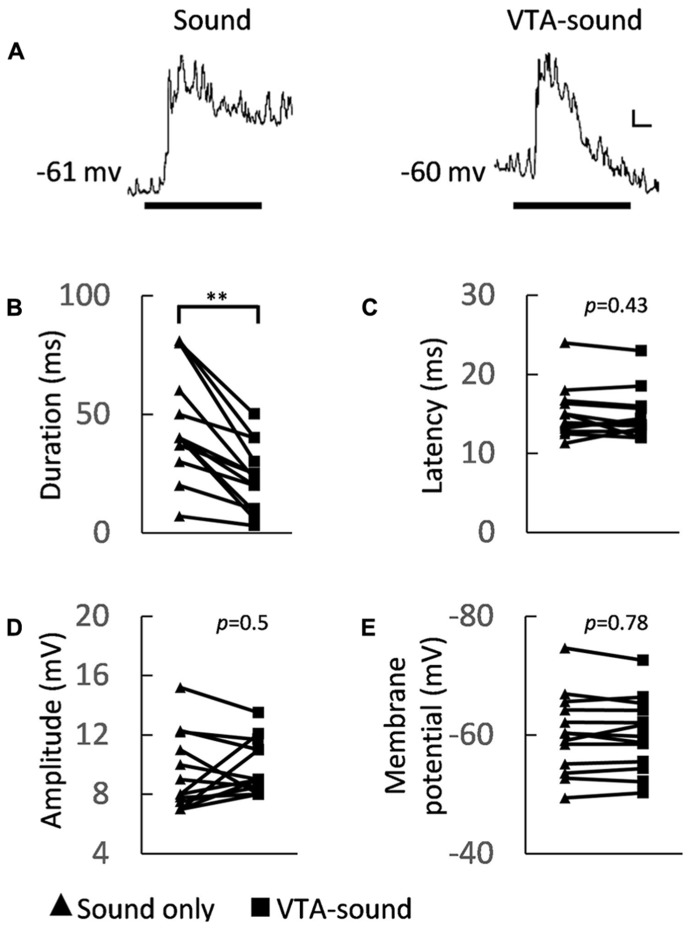
FIGURE 3.
Membrane potential characteristics of A1 neurons under two groups of stimulation. (A) Averaged membrane potential from 13 recorded neurons (left: sound only group; right: paired VTA-sound group). Thick black bar indicates the sound stimulation. Scale bar: 1 mV/10ms. (B) The duration of sound-evoked EPSP became shorter when VTA was activated (sound only: 46.5 ± 23.1 ms; paired VTA-sound: 23.2 ± 14.2 ms, **p < 0.01, paired t-test, n = 13). (C) The peak latency showed no significant difference between two stimulation groups (sound only: 15.1 ± 3.3 ms; paired VTA-sound: 14.8 ± 3 ms, p = 0.43, paired t-test, n = 13). (D) The amplitude of evoked EPSP (sound only: 9.4 ± 2.6 mV; paired VTA-sound: 9.8 ± 1.8 mV, p = 0.5, paired t-test, n = 13) also did not change significantly. (E) The membrane potentials before and after the electric stimulation were measured and no significant difference was found (200 ms window; before: -60.2 ± 6.8 mV; after: -60.1 ± 6.2 mV, p = 0.78, paired t-test, n = 13; filled triangle: sound-only stimulation; filled square: paired VTA-sound stimulation).

