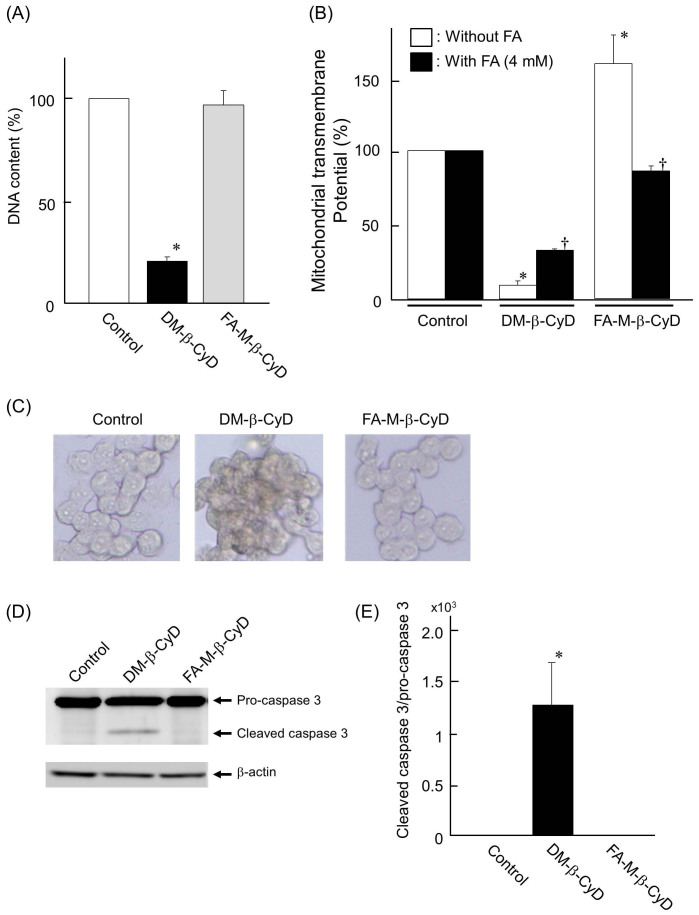
Figure 4.
DNA content (A) and mitochondrial transmembrane potential (B) after treatment with FA-M-β-CyD. KB cells were treated with FA-M-β-CyD (10 mM) for 2 h. Results are represented as mean ± S.E.M. (n = 3–4 per group). *p < 0.05 vs. control. †p < 0.05 vs. KB cells without treatment of FA. (C) TUNEL assay after treatment with FA-M-β-CyD in KB cells. (D) Cleaved caspase 3 assay after treatment with FA-M-β-CyD in KB cells. The cropped blots were indicated. (E) The band intensity of cleaved caspase 3/pro-caspase 3 ratio. Results are represented as mean ± S.E.M. (n = 3 per group). *p < 0.05 vs. control.

