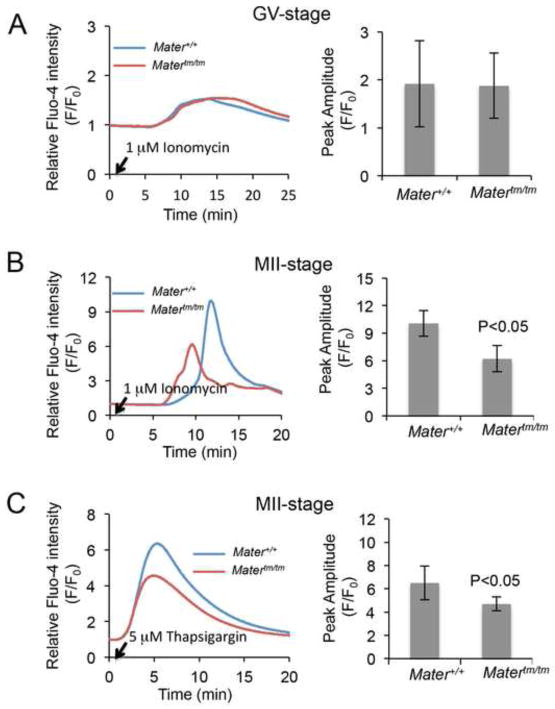
Fig 3.
Matertm/tm MII oocytes demonstrated a decreased Ca2+release from ER compared to Mater+/+ MII oocytes. (A) GV oocytes were loaded with Fluo-4 AM (1 μM), treated with ionomycin (arrow indicates time of treatment) and imaged at ~1.6 second intervals using 20x objective. Histogram of Fluo-4 intensity shows that GV-stage Matertm/tm oocytes responded to ionomycin to a similar degree as Mater+/+ oocytes. (B) MII-arrested Mater+/+ and Matertm/tm oocytes were treated with ionomycin (1 μM) as above. Results show that Matertm/tm oocytes responded to ionomycin to a significantly lesser degree compared to Mater+/+ oocytes. p<0.05 (C) MII Mater+/+ and Matertm/tm oocytes were treated with thapsigargin (5 μM) as above. Similar to ionomycin treatment, the responses of Matertm/tm oocytes to thapsigargin were significantly decreased when compared to Mater+/+ oocytes (p<0.05).

