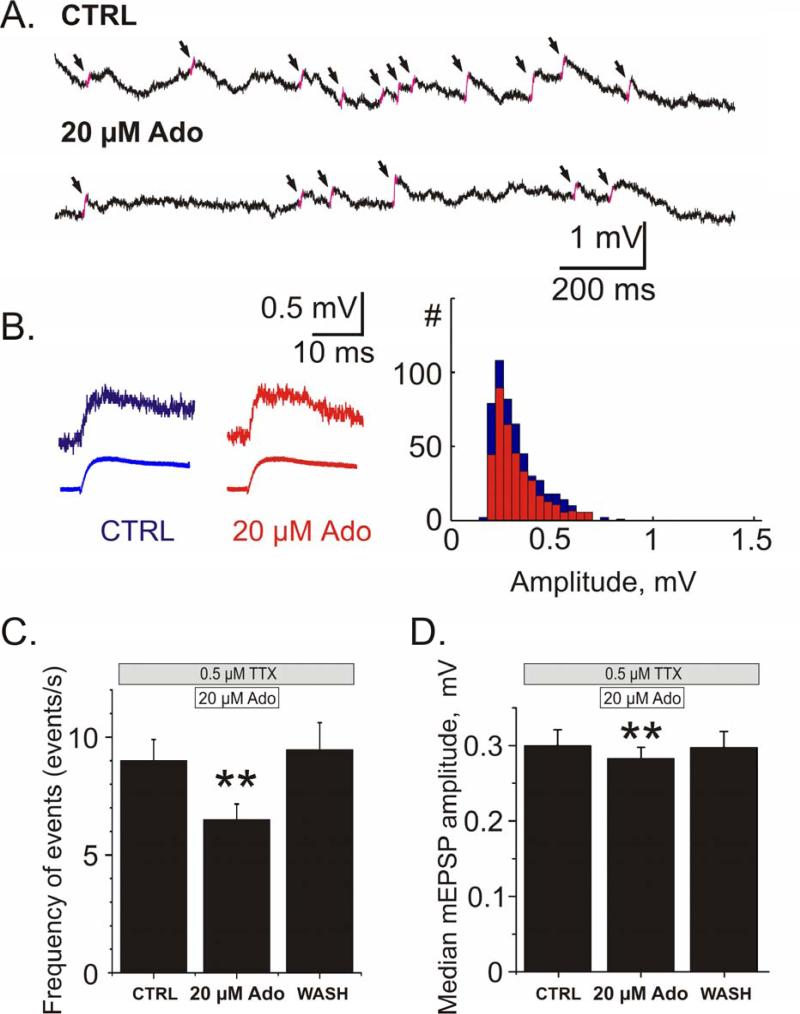
Fig 6. Adenosine reduces miniature EPSP (mEPSP) frequency and decreases the median amplitude of events.
A. Example traces of spontaneous activity from one cell in control and in the presence of 20 μM adenosine. The slopes of detected mEPSPs are highlighted in pink and marked with arrows.
B. Examples of individual (top) and averaged (bottom; N=509 events for CTRL; N=355 events for Ado) miniature EPSPs and their amplitude distributions from 2.5 min recordings in control and during application of 20 μM adenosine.
C, D. Changes of the frequency of mEPSPs (C) and their median amplitude (D) during application of 20 μM adenosine and washout. Both the reduction in frequency of events and median amplitude of events recovered after washout of adenosine. Averaged data for N=18 cells.

