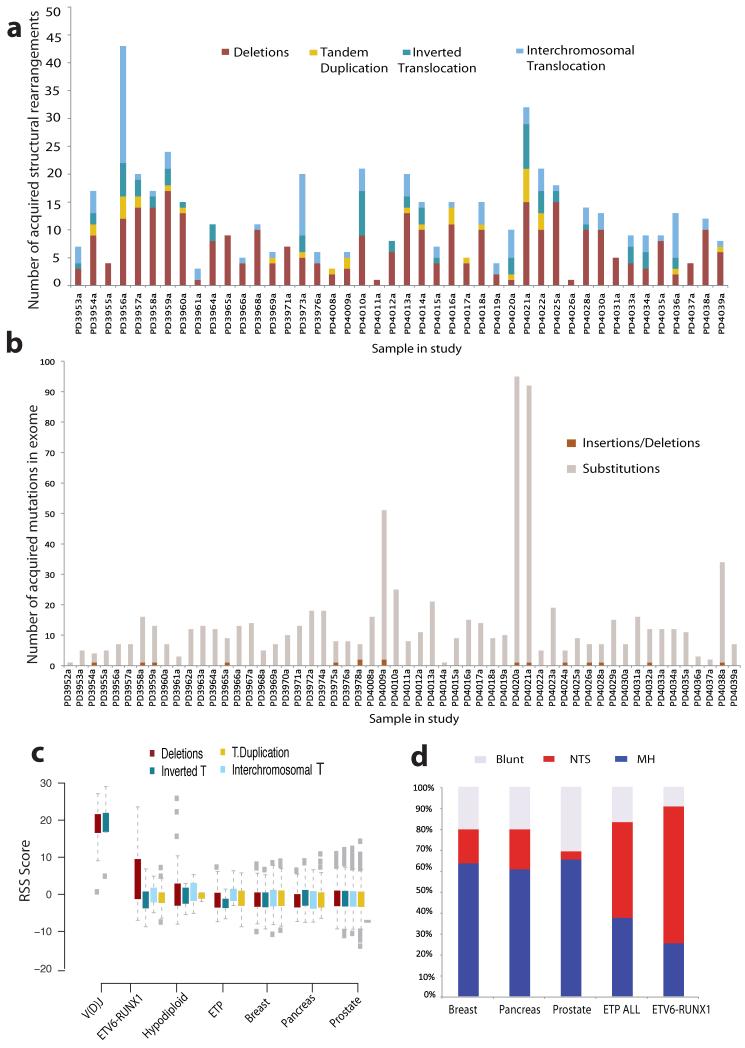
Figure 1. Acquired mutations in ETV6-RUNX1 ALL.
(A) Structural variation in ETV6-RUNX1 ALL. Bar plots representing distribution of genomic rearrangement events in 44 samples (x-axis) with confirmed somatic SVs. Deletions are shown in burgundy, tandem duplications in yellow, inverted intrachromosomal in deep blue and inverted interchromosomal in light blue. All patients harbored the t(12;21) translocation which is not included in the bar plots. (B) Distribution of coding mutations as identified by exome sequencing across each patient in the study. Each sample is represented by a bar on the x-axis and the number of confirmed somatic substitutions and indels by the height of each bar plot on the y-axis. (C) RAG recognition sequence score enrichment in ETV6-RUNX1 deletions. RSS score for each SV class (Deletions, Inverted intrachromosomal rearrangements, Tandem Duplications and Interchromosomal Translocations) in the control V(D)J breakpoints and structural variants in ETV6-RUNX1 ALL, Hypodiploid ALL, ETP-ALL, breast cancer, pancreatic and prostate cancer. An RSS Score of 8.55 corresponds to FDR < 0.01. (D) Breakpoint resolution in ETV6-RUNX1 ALL. Bar charts showing the proportion of resolved breakpoint sequences with non-templated sequence insertion at the breakpoint junction (NTS), evidence of microhomology (MH) between the two ends of the breakpoint or clean blunt-ends at the breakpoint junctions in ETV6-RUNX1 ALL compared to the proportion of each breakpoint class in sets of confirmed rearrangements in Early T progenitor ALL (ETP), breast, pancreatic and prostate cancer.

