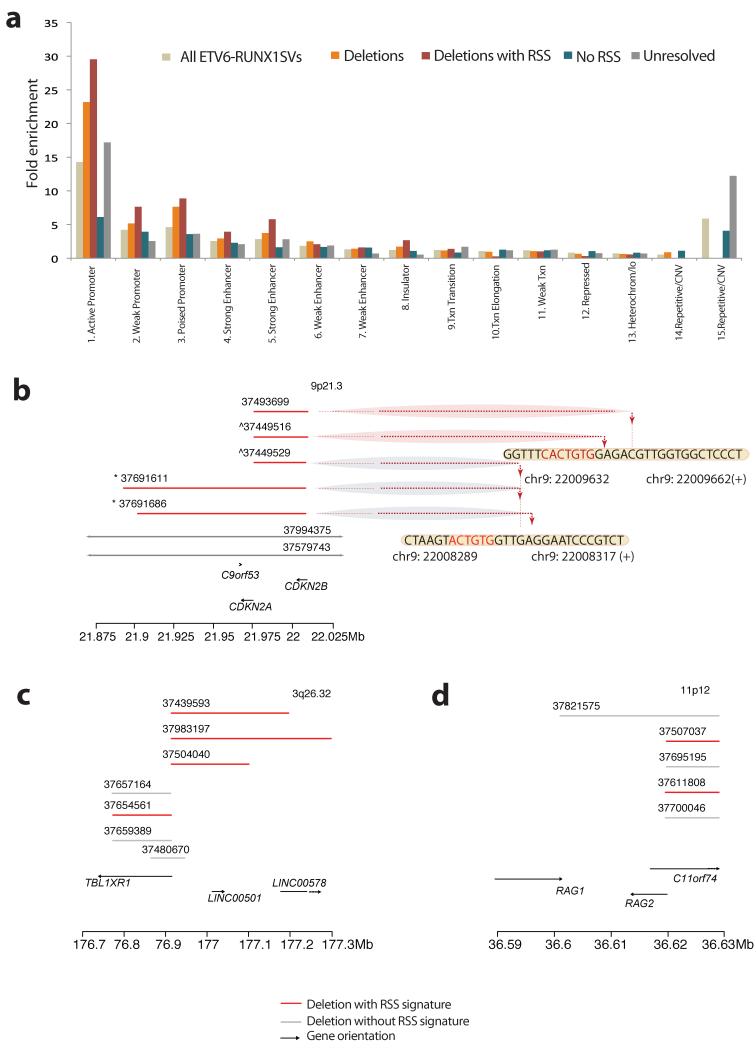
Figure 3. Chromatin segmentation of all somatic SVs in ETV6-RUNX1.
(A) Bar plot of SVs identified in ETV6-RUNX1 ALL that map in one of the 15 chromatin states defined by the ENCODE project from lymphoblastoid cell line GIM12878 genome segmentation. The heights of the bars reflect the fold-enrichment of each SV category for the 15 chromatin states (Supplementary Table 10). ETV6-RUNX1 SVs show significantly different SV distribution from that expected by chance (Goodness of fit test; p<2.2×10⁻¹⁶)(B-D) Clustering of deletion breakpoints (Supplementary Table 12). Red lines represent deletions with resolved breakpoints with either an RSS Score ≥ 8.55 or a heptamer within 20 bp of the breakpoint junction. Grey lines indicate deletions with resolved breakpoints without significant RSS motif scores at their breakpoint junctions. Arrows indicate genes and orientation of transcription. Dotted lines point towards the precise base-pair involved at the breakpoint junction. (B) Clustering of deletions at the CDKN2A locus (9p21.3) with evidence of re-iterated deletions in 2 samples. The signs ^ and * indicate that SVs were identified in the same sample (Supplementary Table 10). (C) Clustering of deletions at the TBL1XR1 locus (9p21.3) and (D) the RAG1/2 locus (11p12).

