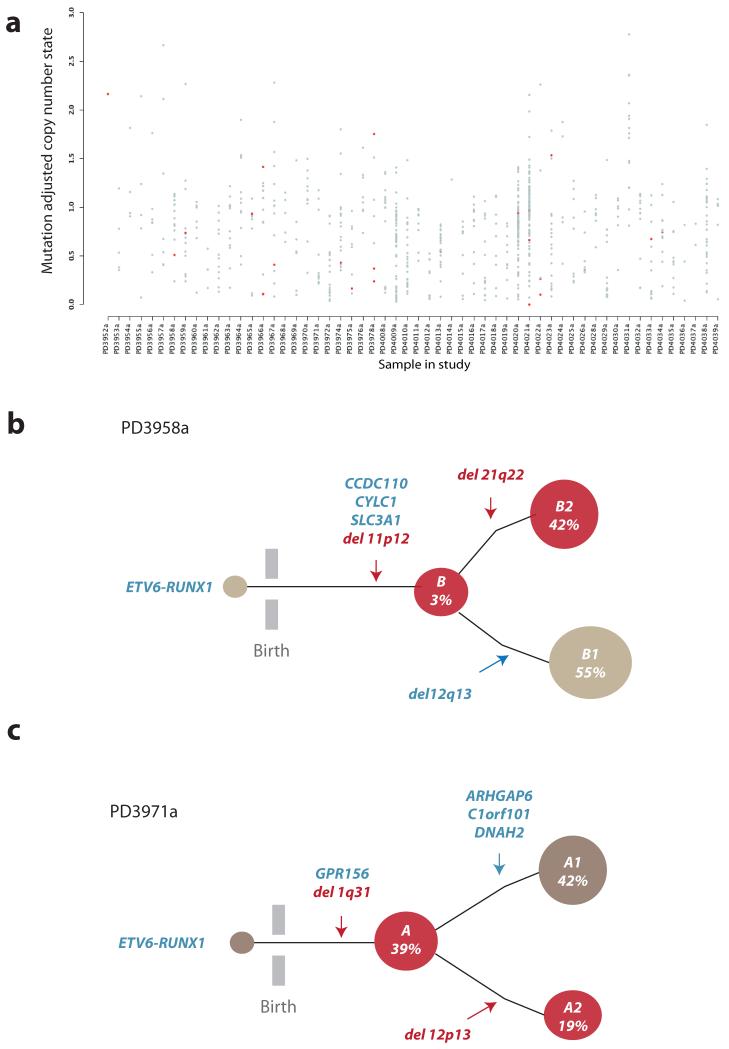
Figure 4. Clonal heterogeneity in ETV6-RUNX1 ALL.
(A) X-axis represents each sample, y-axis the adjusted copy number of each mutation taking into account variant allele fraction and tumor cellularity. Grey dots are all acquired substitutions and indels identified from the exome study. Red dots represent previously characterized oncogenic mutations in cancer (Supplementary Table 6). (B) PD3958a clonal architecture. Acquired mutations are shown in blue whilst SVs with an RSS or RSS-like sequence at the breakpoint junction are shown in red. 139 single cells were positive for the ETV6-RUNX1 fusion gene, the three missense mutations in CCDC110, CYLC1 and SLC3A1, as well as the deletion on 11p12. The remaining two deletions on 12q13 and 21q22.12, were present in 55% and 42% of the cells respectively and were mutually exclusive. Both 11p12 and 21q22.12 deletions contained RSS sequence motifs at the junction. (C) Schematic representation of clonal structure for PD3971a. Acquired mutations are shown in blue whilst SVs with an RSS or RSS-like sequence at the breakpoint junction are shown in red. ETV6-RUNX1 was present in all 130 cells, as were a heterozygous mutation in GPR156 and the deletion mapping to 1q31. Mutations on ARHGAP6, C1orf10 and DNAH2 co-occur within a distinct clonal branch (in grey) representing 39% of the cells whereas the 12p12-13 deletion, which affects ETV6, is present in 19% cells, identifying a distinct subclone (in red).

