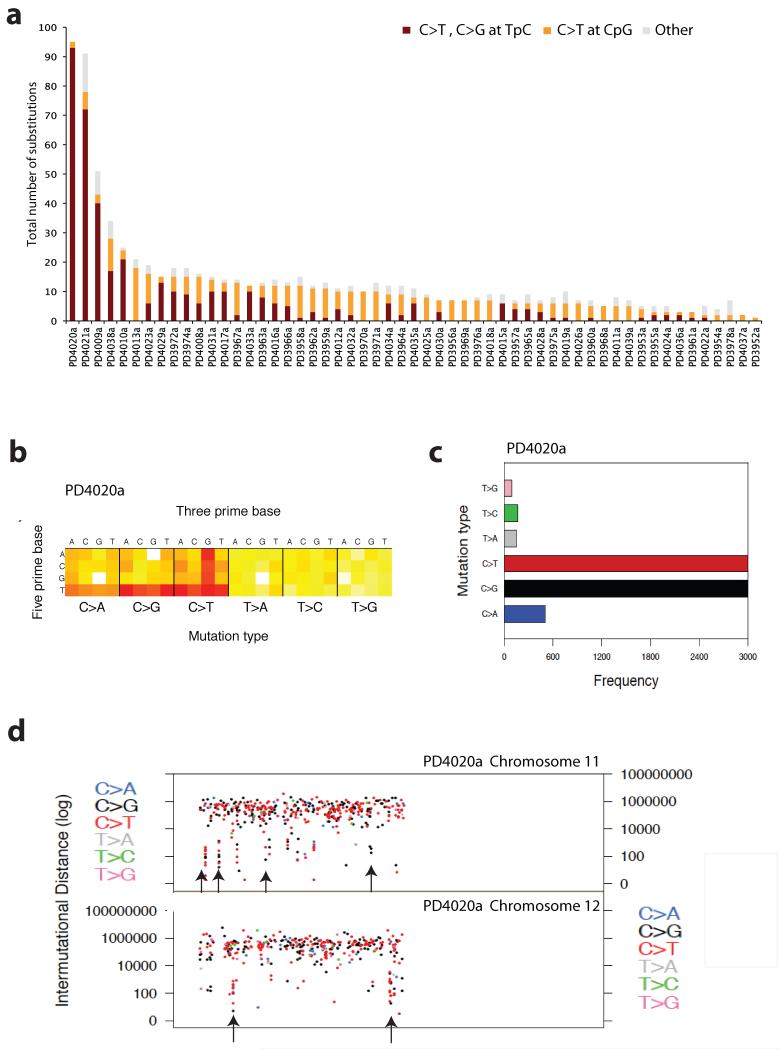
Figure 7. Mutational signatures in ETV6-RUNX1 ALL.
(A) Sequence context of point mutations identified in exome study. In burgundy all point mutations that correspond to a C>T or C>G at a TpC locus, in orange all C>T changes at CpG loci and in grey all remaining acquired substitutions. (B) Heatmap representation of all the mutations identified by whole-genome sequencing in PD4020a. The heatmap is separated into six boxes representing each mutation type(C>A, C>G, C>T, T>A, T>C and T>G). For each mutation type, 16 possible combinations of a 5′ preceding base as shown on the Y axis followed by one of 4 nucleotide basis on the X axis. Red indicates high number of mutations, yellow few and white no such mutations observed. (C) Barplot showing the mutation spectrum across all point mutations identified in the genome for PD4020a. (D) Scatter plot showing mutations clusters in chromosomes 11 and 12 identified by whole-genome sequencing of PD4020a. Each dot represents a mutation type, in blue C>A, black C>G, red C>T, grey T>A, green T>C and pink T>C. The order of the mutations along the x-axis reflects their position in the genome but not the precise chromosome coordinate i.e. mutation 1 followed by mutation 2, etc. The height of each subsequent mutation reflects the distance from the preceding mutation on a log scale i.e. 100bp, 1000bp or 1 MB. Mutation trickles are seen where localized clusters of hypermutation are observed, mostly comprised of C>G or C>T mutations (Supplementary Table 18).

