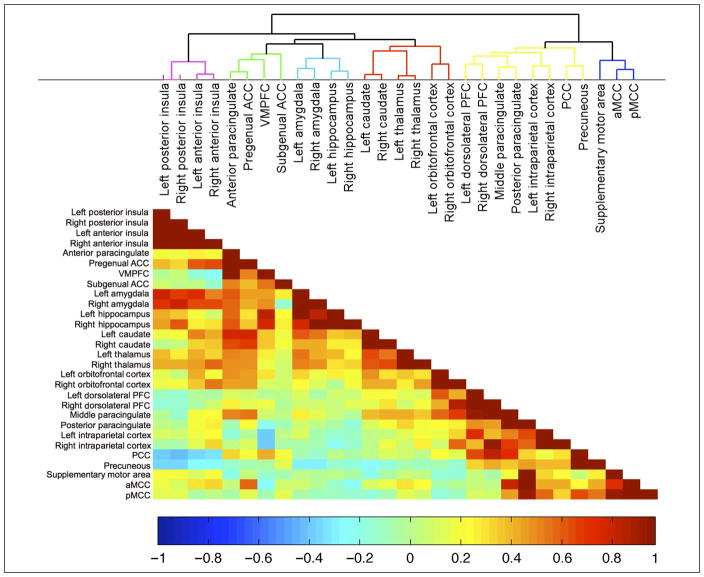
Figure 3.
Mean resting state connectivity networks as measured by hierarchical clustering analysis of correlation between resting state BOLD time series derived from 29 subject-specific redefined ROIs (see also Figure 2). The cluster tree (top) shows that the 29 regions cluster into six subnetworks. Colors within the correlation matrix (bottom) indicate correlation strength.

