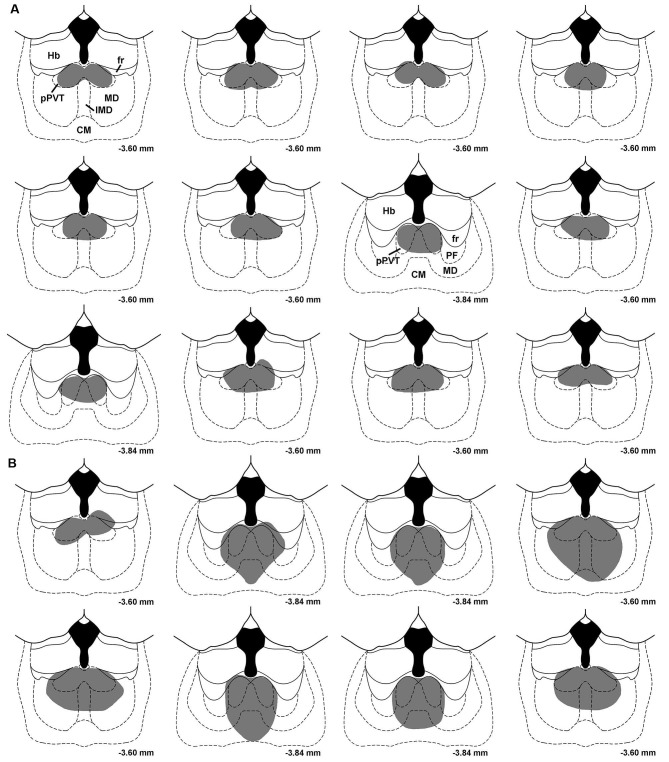
Figure 2.
Drawings showing the location of midline thalamic lesions. Each section represents subjects that were assigned to the pPVT lesion group (A) and the midline lesion group (B). CM, centromedial nucleus; fr, fasciculus retroflexus; Hb, habenula; IMD, intermediodorsal nucleus; MD, mediodorsal nucleus; PF, parafascicular nucleus; pPVT, posterior paraventricular nucleus of the thalamus. Numbers represent the distance from bregma.

