
Figure 2.
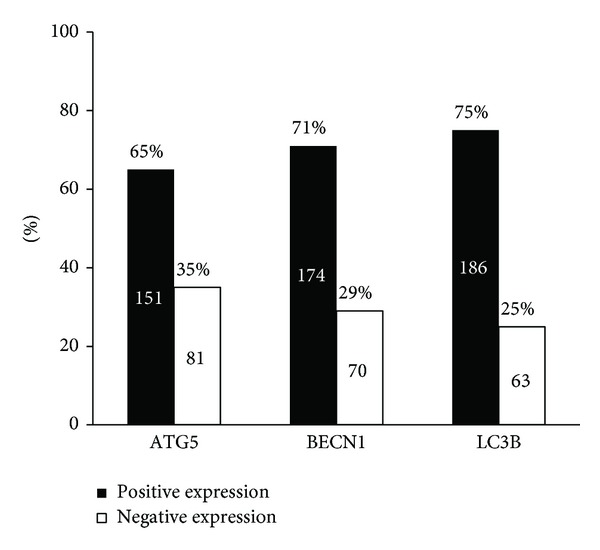
Expression levels of autophagy-related proteins were dichotomized into positive and negative categories based on the intensity and percentage of staining. Missing data for ATG5 (n = 31), BECN1 (n = 19), and LC3B (n = 14).
Official websites use .gov
A
.gov website belongs to an official
government organization in the United States.
Secure .gov websites use HTTPS
A lock (
) or https:// means you've safely
connected to the .gov website. Share sensitive
information only on official, secure websites.
Expression levels of autophagy-related proteins were dichotomized into positive and negative categories based on the intensity and percentage of staining. Missing data for ATG5 (n = 31), BECN1 (n = 19), and LC3B (n = 14).