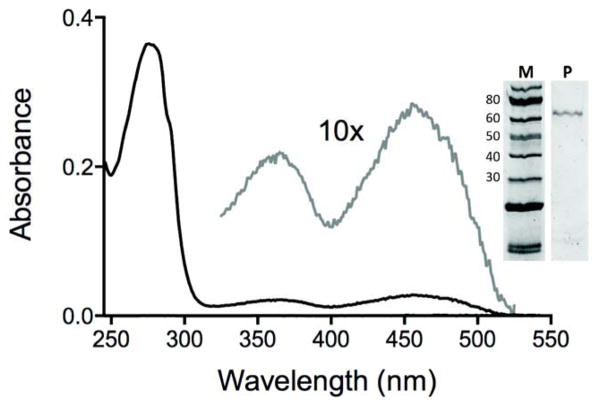
Fig. 2.
UV-VIS spectrum of the sulfhydryl oxidase purified from adult bovine serum. The main panel shows the spectrum of the oxidase recorded in 50 mM phosphate buffer, pH 7.5, containing 1 mM EDTA. The dashed line highlights the flavin region of the spectrum. The inset shows an SDS-PAGE analysis of the purified protein.

