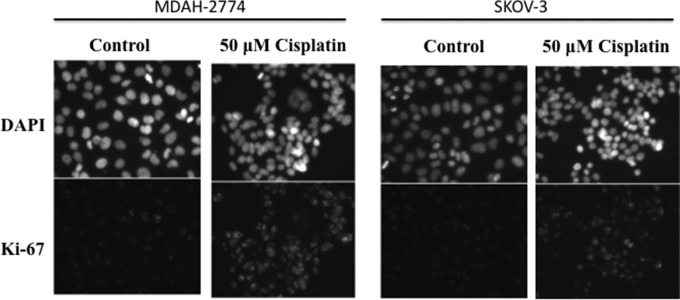
Figure 3.
Proliferation of epithelial ovarian cancer cells lines (A) MDAH-2774 and (B) SKOV-3 cultured in the presence of cisplatin (50 µmol/L). The columns represent control and high dose (50 µmol/L) of cisplatin treatments and the rows illustrate anti-Ki-67 antibody and 4′,6-diamidino-2-phenylindole counterstains.

