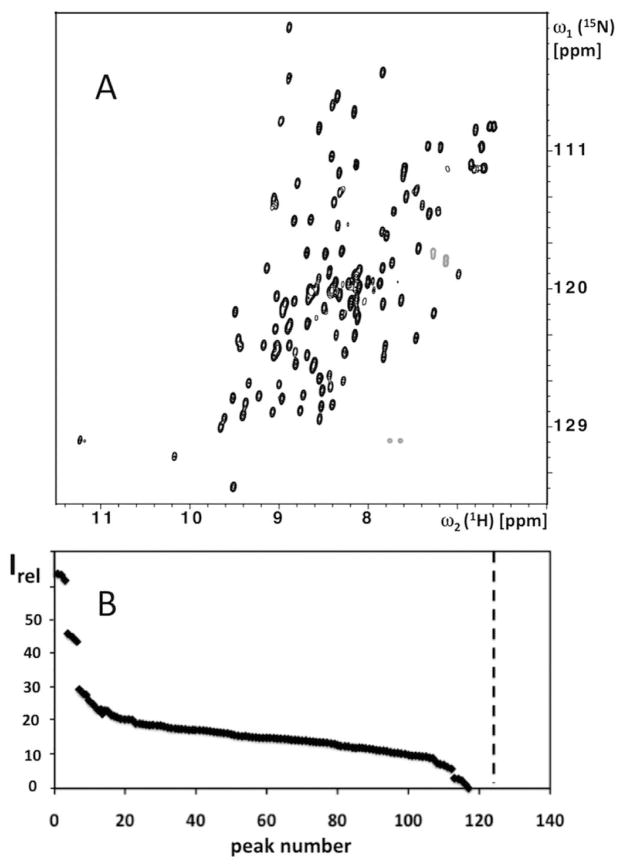
FIGURE 1.
(A) Contour plot of a 2D [15N,1H]-HSQC spectrum of a 1.2 mM solution of the 15N-labeled protein YP_001302112.1 from Parabacteroides distasonis measured on a Bruker AVANCE 700 MHz spectrometer equipped with a room temperature 1.7 mm TCI probehead (HSQC stands for “heteronuclear single-quantum coherence” and designates a specific type of COSY experiment).18 (B) NMR-Profile resulting from the analysis of the spectrum in (A). The backbone amide group and Trp indole group signals are plotted along the horizontal axis in the order of decreasing intensities, Irel, which are indicated by black diamonds. The dotted vertical line indicates the number of peaks expected from the amino acid sequence (see text).

