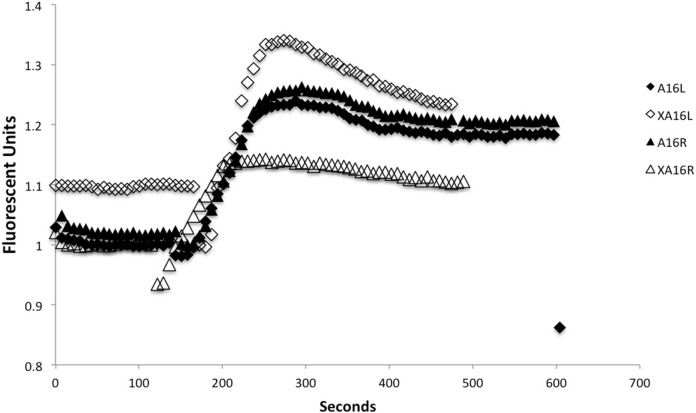
FIGURE 5.
The slope for all is 0.003 and the “rise” or change in the value of Y from the lowest to highest point is 0.25 approximately for all. Legend for symbols A16L = Left hemisphere from rat 16 directly irradiated to the right hemisphere, A16R = Right hemisphere from rat 16 directly irradiated to the right hemisphere. XA16L = left hemisphere of unirradiated cage mate of rat 16. XA16R = right hemishphere of unirradiated cage mate of rat 16.

