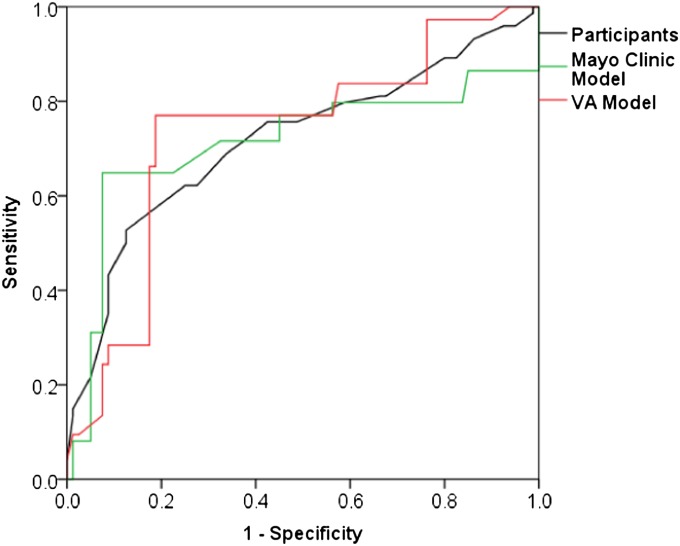
Figure 3.
Receiver operating characteristic (ROC) curves representing the accuracy of predictions by physician participants (black), the Mayo Clinic model (green), and the Veterans Affairs (VA) model (red). Areas under the ROC curve were 0.70 (95% confidence interval [CI], 0.62–0.78) for participants, 0.71 (95% CI, 0.62–0.80) for the Mayo Clinic model, and 0.72 (95% CI, 0.64–0.81) for the VA model. Differences in accuracy between participants and the Mayo Clinic model (P = 0.46) and between participants and the VA model (P = 0.30) were not statistically significant.

