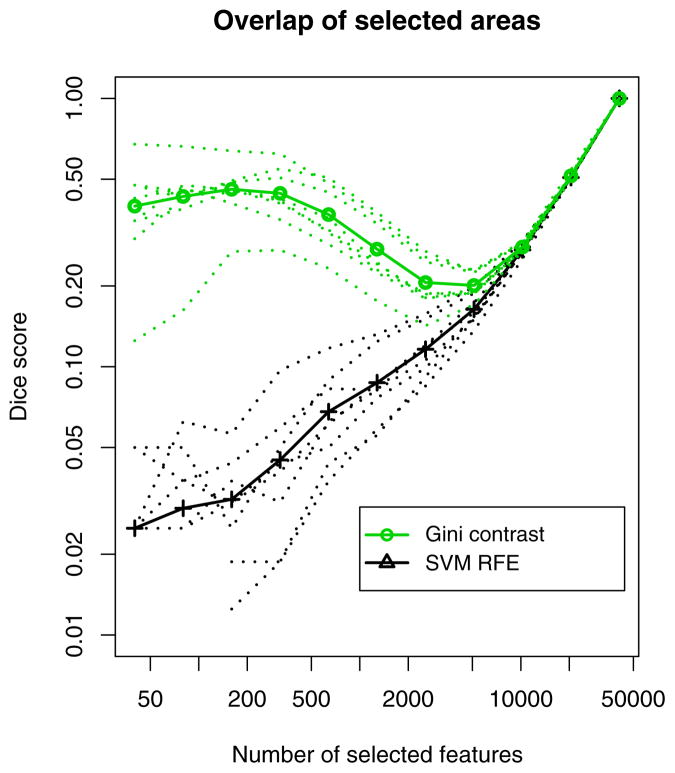
Figure 8.
Dice measure of overlap between identified voxels in the two-fold cross-validation. Voxel sets selected by Gini contrast (green) exhibit far higher overlap compared to those selected by RFE (black). The thick lines show the mean over all subjects and all categories. The thin lines show average overlap for each category separately. Both axes use log scale.

