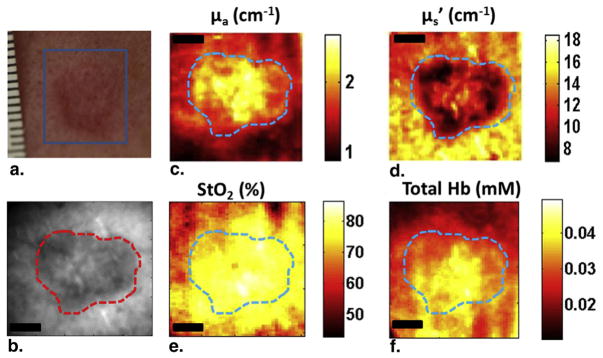
Figure 3.

Spatial frequency domain imaging results for patient 1 having basal cell carcinoma. (a) White light picture of the lesion; (b) reflectance image at 590 nm; (c) absorption map; (d) scattering map; (e) and (f) show the StO2 and total hemoglobin concentration maps, respectively. The dashed line marks tumor boundary. Scale bar corresponds to 2 mm.
