
Figure 4.
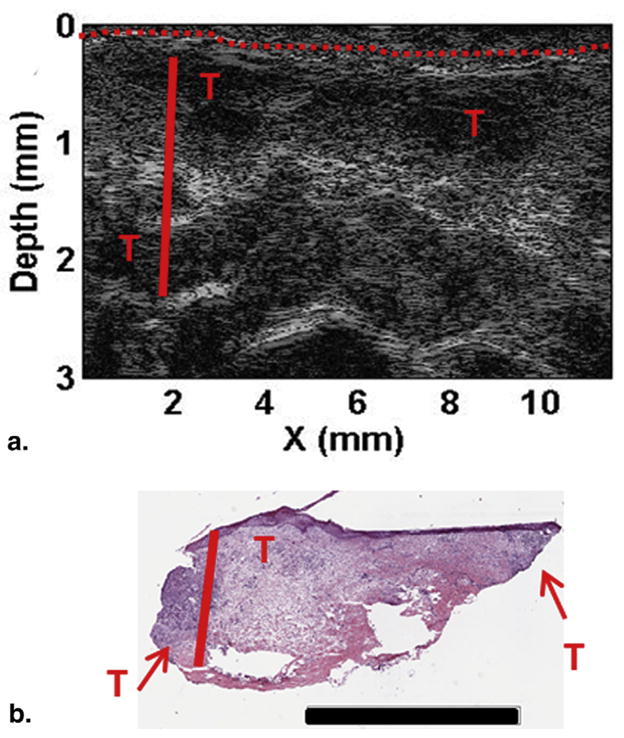
Depth profiling for patient 1. (a) High frequency ultrasound image and (b) H&E staining. Skin surface marked with the red dashed line, depth to the deepest tumor marked with the solid red line, and suspicious areas are marked with red “T”s. Scale bar in (b) corresponds to 3 mm. For interpretation of the references to color in this figure legend, the reader is referred to the web version of this article.