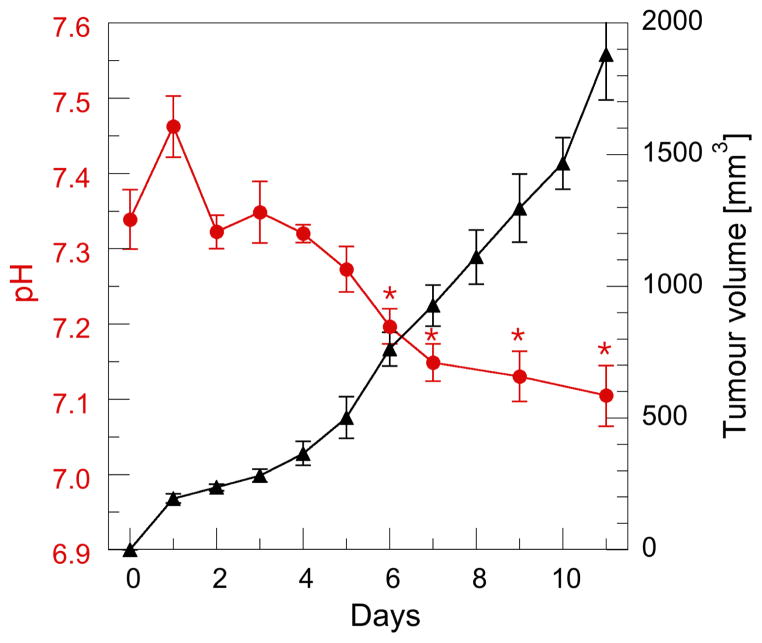
Figure 4.
Relationship between tumour volume and pHe during normal tumour growth. Each data point represents the mean of 6 mice with standard error of the mean (SEM) displayed. Day 0 - prior to squamous cell injection into the right hind leg. An inverse relationship between tumour volume and pHe was observed in all mice from Day 3. Significant difference in pHe between Day 0 and Day N is shown * (p < 0.05).

