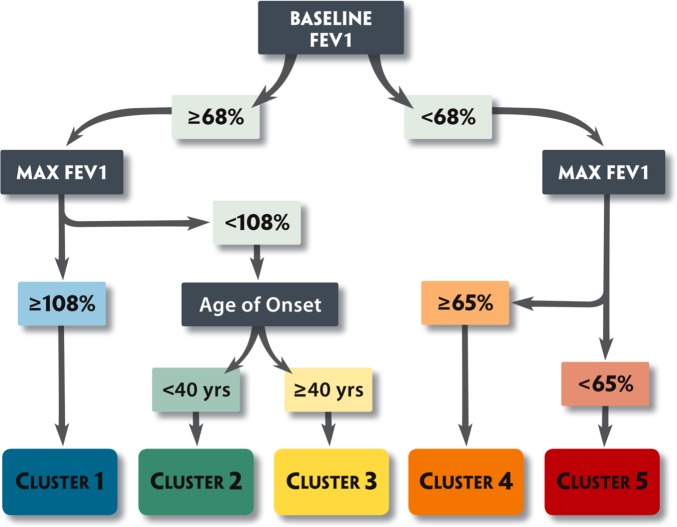
Figure 3.
Tree analysis. Subjects can be assigned to the five clusters that range from milder asthma (Cluster 1) to more severe disease (Clusters 4 and 5) using three variables: (1) baseline FEV1 (with a bronchodilator withhold); (2) maximal (Max) FEV1 (after six to eight puffs of albuterol); and (3) age of onset of asthma. Blue, mild atopic asthma; green, mild to moderate atopic asthma; yellow, late-onset nonatopic asthma; orange, severe atopic asthma; red, severe asthma with fixed airflow. Reproduced by permission from Reference 11.

