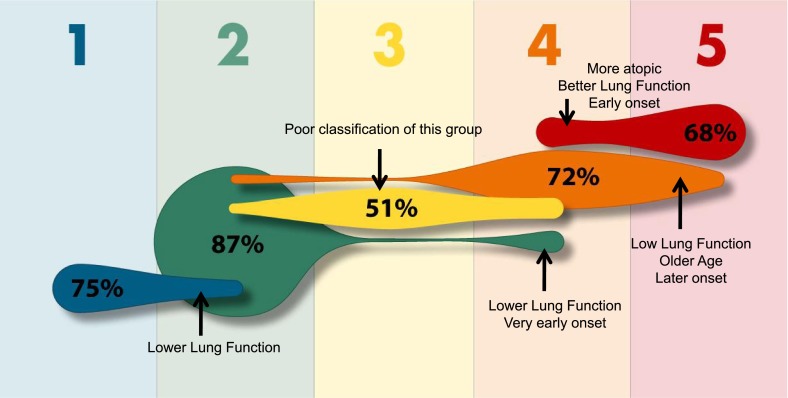
Figure 4.
Misclassification of predicted SARP clinical cluster assignment by the tree diagram. Using the three-variable tree algorithm, the percent of subjects correctly assigned to each cluster is indicated within each shape. Cluster assignment is incorrect in a subset of subjects (indicated by arrows), due to heterogeneity in lung function or age of asthma onset within a given cluster; misclassified subjects are on the “edge” when compared with the majority of subjects within a given cluster. Blue, mild atopic asthma; green, mild to moderate atopic asthma; yellow, late-onset nonatopic asthma; orange, severe atopic asthma; red, severe asthma with fixed airflow. Individual figure size is proportional to the frequency of a specific cluster. Adapted with permission from Reference 11.

