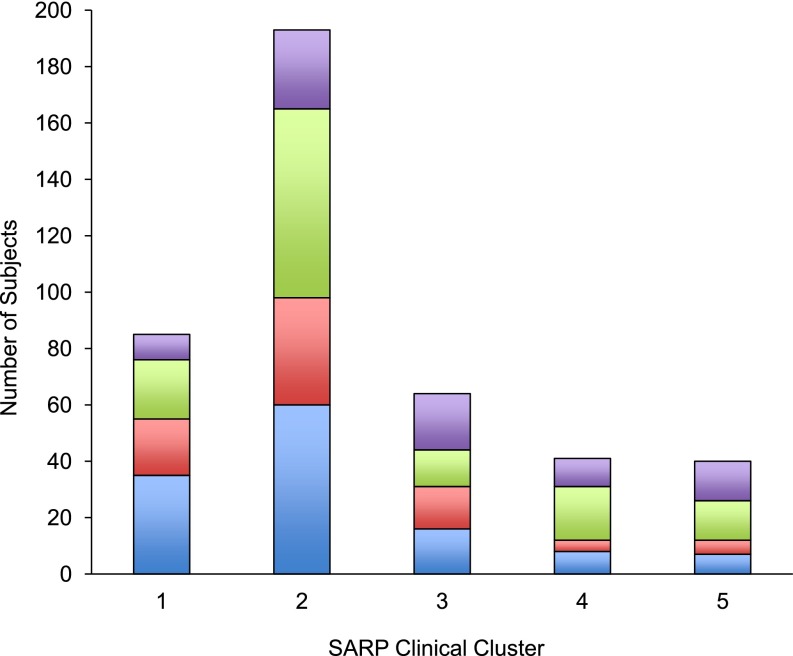
Figure 6.
Sputum inflammatory profiles in SARP clinical clusters. Inflammatory profiles were determined for individual subjects based on percent eosinophils (≥2%) and percent neutrophils ≥40% in induced sputum (n = 423). All four patterns are present in each cluster, indicative of heterogeneity of cellular inflammation within each group. Blue, paucigranulocytic; red, eosinophil predominant; green, neutrophil predominant; purple, mixed granulocytic.

