
Figure 2. UBQLN2 binds to full length TDP-43 and C-terminal TDP-43 (261-414aa), but not N-terminal TDP-43 (1-260 aa).
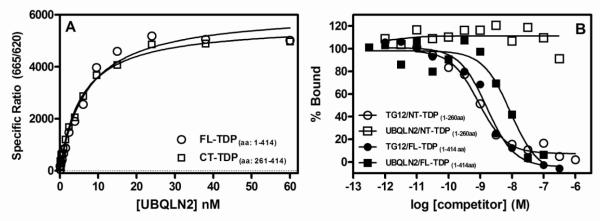
(A) A series of concentrations of UBQLN2 (0.1 to 60 nM) was incubated for 2 hr at room temperature with full length TDP-43 (100 ng/mL, 1.6 nM) or C-terminal TDP-43 fragment (100 ng/mL, 4.6 nM) followed by the addition of HTRF antibodies with subsequent ratiometric measurement of time-resolved fluorescence as described in Section 2.3. (B) A series of concentrations of unlabeled TG12 (1.0 pM to 1.0 μM) or UBQLN2 (0.30 pM to 0.3 μM) were incubated for 2 hr with either full length TDP-43 (100 ng/mL, 1.6 nM) or N-terminal TDP-43 (100 ng/mL, 2.2 nM) along with 1.0 nM bt-TG12 followed by the addition of HTRF antibodies with subsequent ratiometric measurement of time-resolved fluorescence as described in Section 2.3. Nonspecific binding was determined in the absence of TDP-43. Equilibrium dissociation rate constants (KD) (A) or IC50 values (B) were determined by nonlinear regression fits of the data to either a one-site binding equation or three parameter dose-response equation, respectively, using Graph Pad Prism®. Data are the means of duplicate determinations from a single experiment that was repeated three times with similar results.