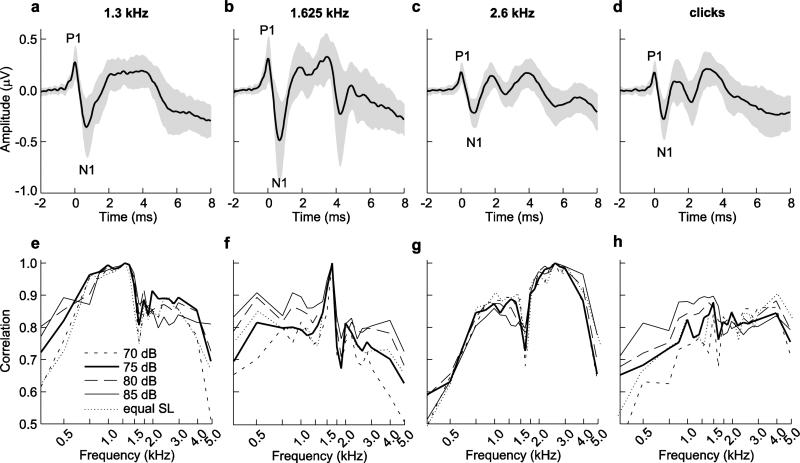
Fig. 3.
a-d Average traces temporally aligned to P1 (time = 0 ms) in response to tones of 75 dB SPL at frequencies of a 1.3 kHz, b 1.625 kHz, and c 2.6 kHz and to d clicks of 75 dB pSPL. Shaded areas depict ± 1 s.d. e-h Cross correlation coefficients between the average response to tones presented at frequencies of e 1.3 kHz, f 1.625 kHz, and g 2.6 kHz or to h clicks and average responses to all tone frequencies. Legend in e applies to e-h and is in units of dB SPL (for tones) or dB pSPL (for clicks)

