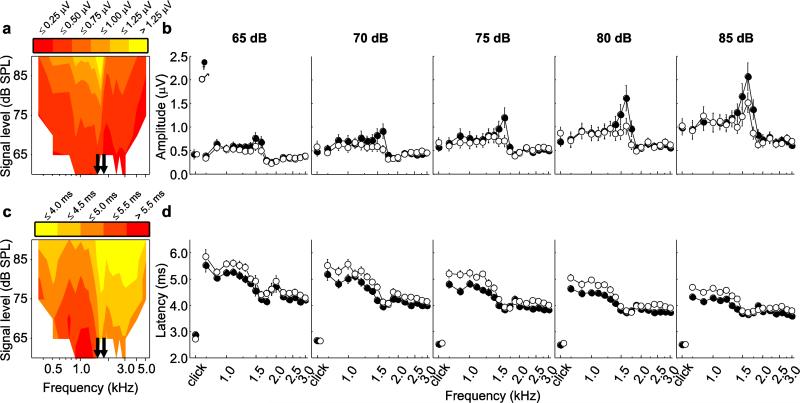
Fig. 4.
Characterization of the ABR in terms of a-b amplitude (absolute voltage difference between P1 and N1) and c-d latency (time to P1 from sound arrival at tympanic membranes). a & c Mean amplitude and latency (averaged over all individuals) depicted in the form of a contour plot across all frequencies and all levels. Arrows indicate the range of frequencies (1.5 – 1.75 kHz) within which there is a sharp discontinuity in the values of the response measure. b & d Mean (±s.e.m.) amplitude and latency of click-evoked responses and tone-evoked responses across frequencies at five stimulus levels. Data are shown separately for males (open circles) and females (filled circles). The data depicted in b and d represent reduced datasets that included responses to clicks at levels of 65 to 85 dB pSPL and tones of frequencies from 0.75 kHz to 3.0 kHz presented at levels of 65 dB to 85 dB SPL. Plotted data were pooled across multiple imputations of the reduced datasets (see text). Values for some click-evoked responses are slightly displaced along the x-axis to reveal symbols otherwise hidden

