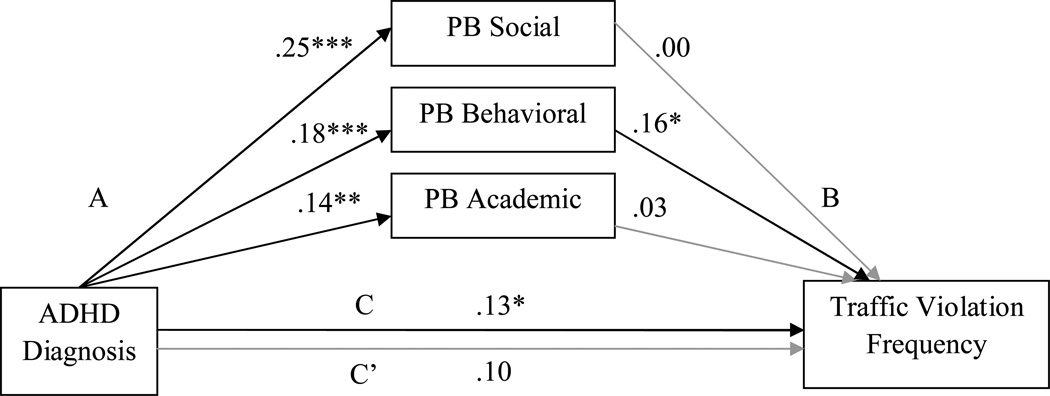
Figure 3.
Path model predicting traffic violation frequency
Note. PB= positive bias; standardized coefficients are reported. The effect of ADHD on traffic violation frequency without PB included in the model is reported above the line (path C) and with PB included is reported below the line (path C’). Estimated childhood IQ, maternal-rated conduct disorder symptoms, and age at Time 2 were included as covariates; n=510; *p<.05, **p<.01, ***p<.001.

