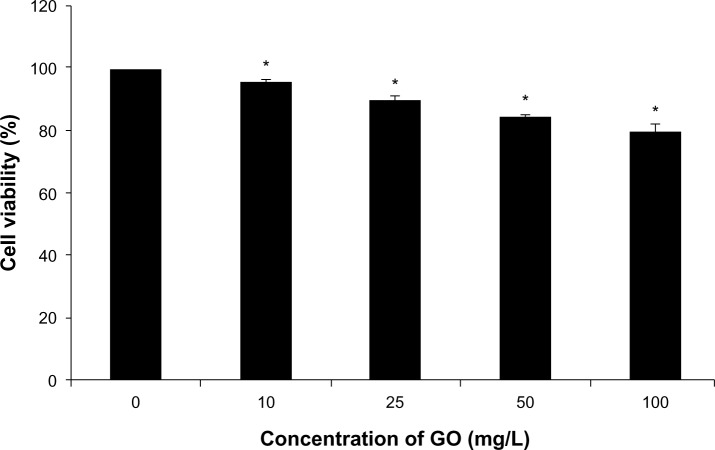
Figure 1.
The effect of GO (10, 25, 50, and 100 mg/L; size <100 nm) on cell viability of RPMI-8226 cells for 24 hours.
Notes: Each bar represents the mean ± SD of three independent experiments. *P<0.05 denotes significant differences between mean values measured in the GO group and those in control group.
Abbreviations: GO, graphene oxide; SD, standard deviation.

