
Figure 4.
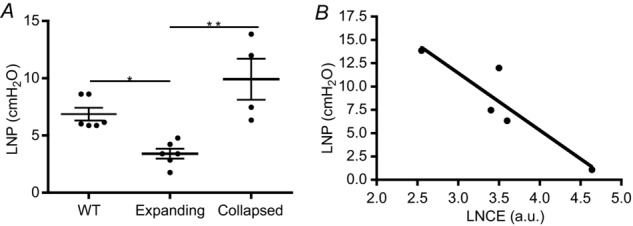
A, PLN in TNF-Tg mice were phenotyped as expanding or collapsed via CE-MRI, and their LNP was assessed along with their WT littermates (ages 4–10 months) as described in the Methods section (**P < 0.01, *P < 0.05 by Kruskal–Wallis ANOVA with a Dunn's post hoc test). B, a linear regression analysis was performed to demonstrate the significant correlation between LNP and LNCE (r2 = 0.83, P = 0.037).