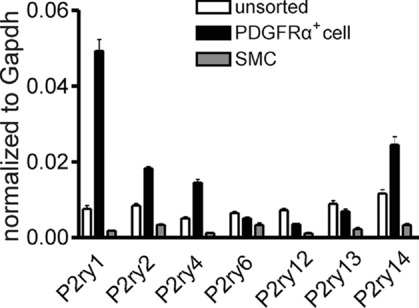
Figure 1.

Summary graph showing that P2ry1, P2ry2, P2ry4 and P2ry14 were enriched in PDGFRα+ cells vs. SMCs or unsorted cells. Relative expression of all transcripts was normalized to Gapdh.

Summary graph showing that P2ry1, P2ry2, P2ry4 and P2ry14 were enriched in PDGFRα+ cells vs. SMCs or unsorted cells. Relative expression of all transcripts was normalized to Gapdh.