
Figure 7.
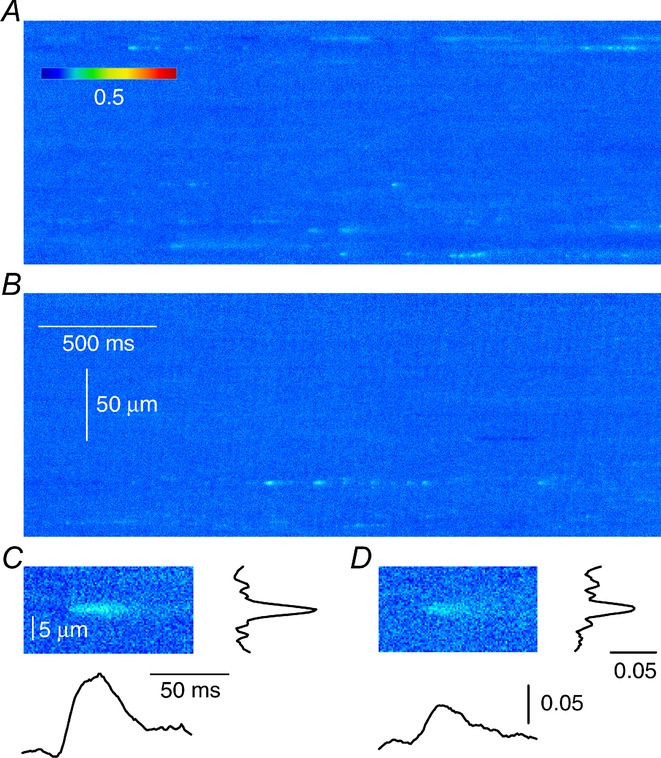
A and B, line-scan images from fibres of FDB muscles taken from control (A) and from Cmpt (B) mice. Enzymatically isolated fibres were permeabilized with a brief exposure to 0.01% Saponin and loaded with Fluo-3. C and D, representative sparks with their spatial profiles and time courses detected in control (C) and in Cmpt (D) mice. Spatial and temporal profiles were calculated from the average of five consecutive rows or columns at the maximum of the event. Acquisition parameters: 4096 × 512 pixels, 1 ms line−1, 0.33 μm pixel−1; temperature 22°C.