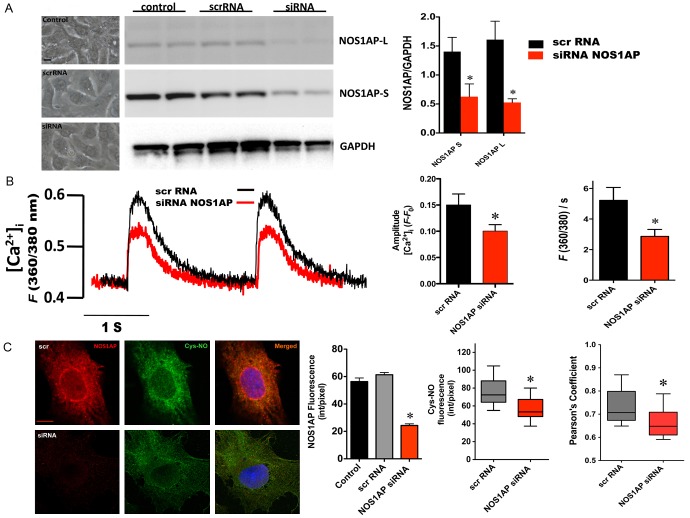
Figure 3.
Impact of NOS1AP gene silencing on [Ca2+]i transients and S-nitrosylation. A. Left panel, representative images of NRVM after transfections. Middle panel, representative Western blots of cell lysates from control NRVM, NRVM transfected with scramble RNA (scrRNA) or NOS1AP siRNA (siRNA), probed with anti-NOS1AP antibody, showing the expression of NOS1AP- L and S isoforms. GAPDH was used as loading control. The graph depicts densitometric analysis (n=4). B. Assessment of [Ca2+]i transients. Representative [Ca2+]i transients of myocytes transfected with scrRNA (black line) or NOS1AP siRNA (red line). The graph shows the analysis for amplitude and departure velocity (F 360/380/s) of the electrically evoked [Ca2+]i transients in NOS1AP siRNA (n=15, red bars) and scrRNA-treated cells (n=9, black bars). C. Representative immunostaining for NOS1AP and S-nitroso-cysteine (Cys-NO) in myocytes after transfection with scrRNA or NOS1AP siRNA. The bar indicates 20 μm. The graphs depicts immunofluorescence intensity for NOS1AP and CySNO and the degree of co-localization for NOS1AP/Cys-NO. N=8 cells for each treatment. Asterisks indicate P<0.05 siRNA vs. scrambled RNA.

