
Figure 3.
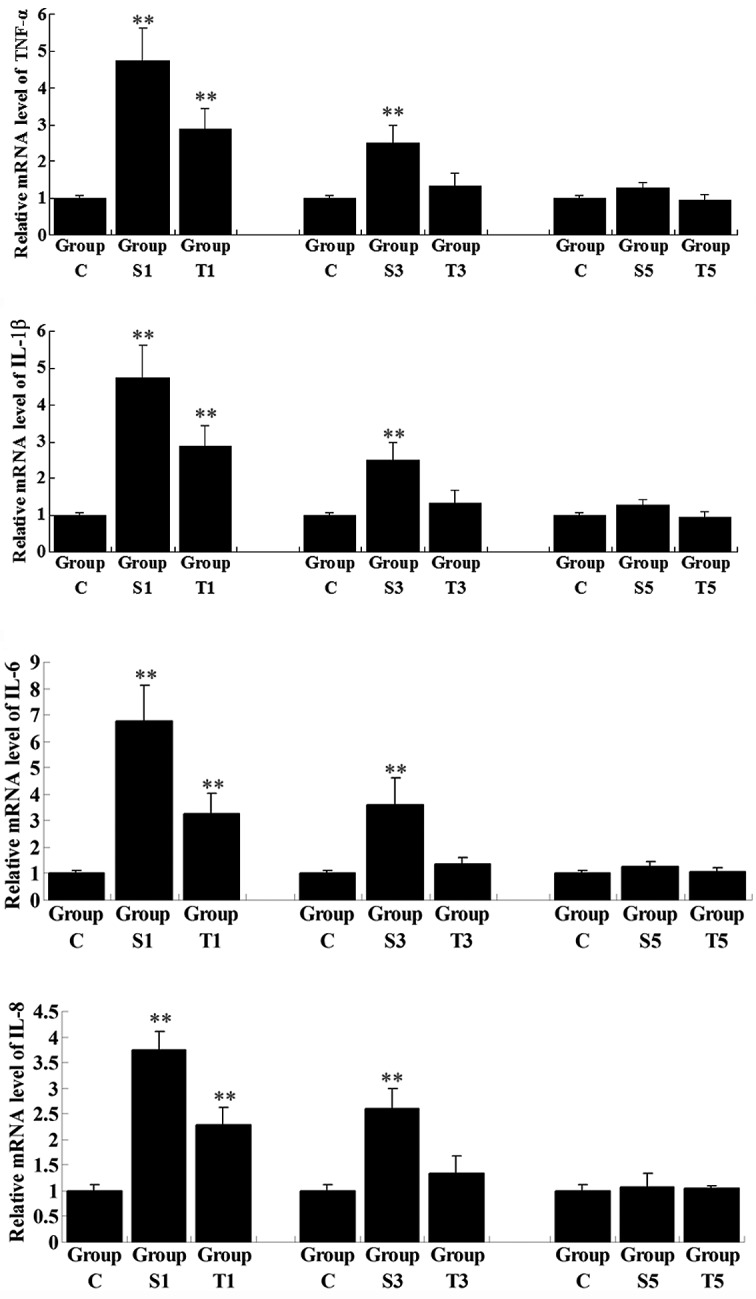
Quantitative reverse transcription-polymerase chain reaction (qPCR) assay for the relative mRNA expression of pro-inflammatory cytokines in rat hippocampal tissues. Group C, control group without surgery; Groups S1, S3 and S5, surgery group without any treatment on days 1, 3 and 5 postoperatively; Groups T1, T3 and T5, surgery group with senegenin treatment on days 1, 3 and 5 postoperatively. Results are presented as the mean ± standard deviation. **P<0.01 compared with Group C. TNF-α, tumor necrosis factor-α; IL-1β, interleukin-1β.