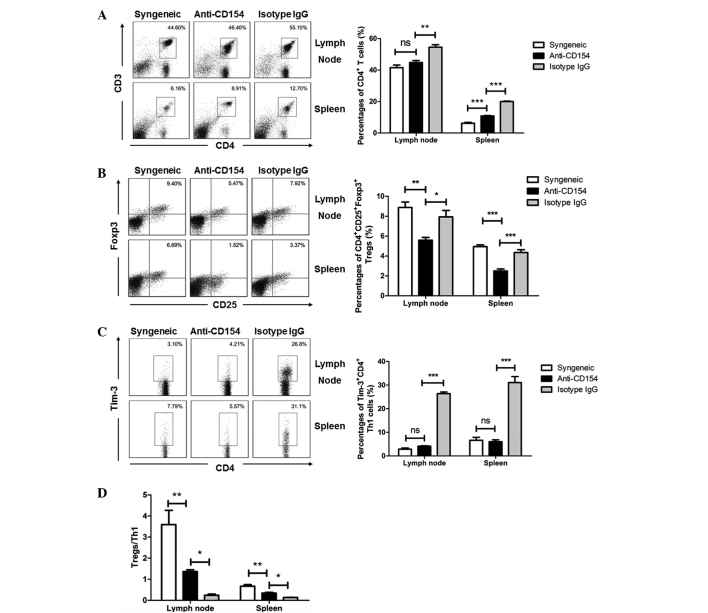
Figure 3.
Flow cytometric analysis of the concentrations of CD4+ T, CD4+CD25+Foxp3+ Tregs and Tim-3+ CD4+ Th1 cells in the spleens and lymph nodes of mice. On day 14 following transplantation, mice were sacrificed and the ipsilateral lymph nodes and spleens were obtained from syngeneic corneal graft recipient mice and allograft recipient mice treated with anti-CD154 or isotype IgG (n=5 per group). The frequencies of CD4+ T, CD4+CD25+Foxp3+ Tregs and Tim-3+ CD4+ Th1 cells were determined by flow cytometry. (A) Representative and quantitative flow cytometry results for CD4+ T cells in the spleens and lymph nodes. Numbers within each quadrant represent the percentages of CD4+ T cells. (B) Representative and quantitative flow cytometry results for CD4+CD25+Foxp3+ Tregs in the spleens and lymph nodes. Numbers within each quadrant represent the percentages of CD4+CD25+Foxp3+ Tregs. (C) Representative and quantitative flow cytometry results for Tim-3+ CD4+ Th1 cells in the spleens and lymph nodes. Numbers within each quadrant represent the percentages of Tim-3+ CD4+ Th1 cells. (D) Ratio of Tregs to Th1 cells in spleens and lymph nodes. Data are presented as the mean ± standard deviation. Analysis of variance with Bonferroni corrections was performed to evaluate statistical significance. *P<0.01; **P<0.001; ***P<0.0001. NS, no significance.

