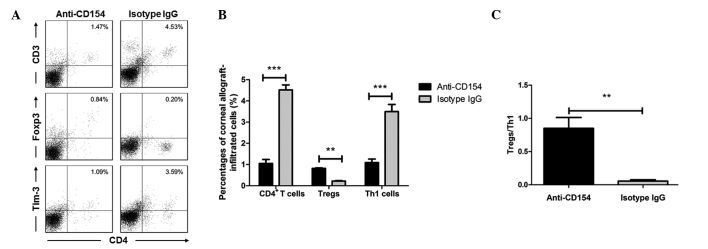
Figure 4.

Flow cytometric analysis of corneal allograft-infiltrated CD4+ T, CD4+CD25+Foxp3+ Tregs and Tim-3+ CD4+ Th1 cells in mice. Corneal grafts were harvested from recipient mice treated with anti-CD154 or isotype IgG 14 days post surgery (n=5 per group). The frequencies of CD4+ T, CD4+CD25+Foxp3+ Tregs and Tim-3+ CD4+ Th1 cells were analyzed by flow cytometry. (A) Representative flow cytometry results. Numbers within each quadrant represent the percentages of CD4+ T, CD4+CD25+Foxp3+ Tregs and Tim-3+ CD4+ Th1 cells. (B) Quantitative results of the frequencies of CD4+ T, Th1 cells and Tregs in corneal grafts. (C) Ratio of Tregs to Th1 cells in corneal grafts. Data are presented as the mean ± standard deviation. P-values were calculated using Student’s t-test. **P<0.001; ***P<0.0001.
