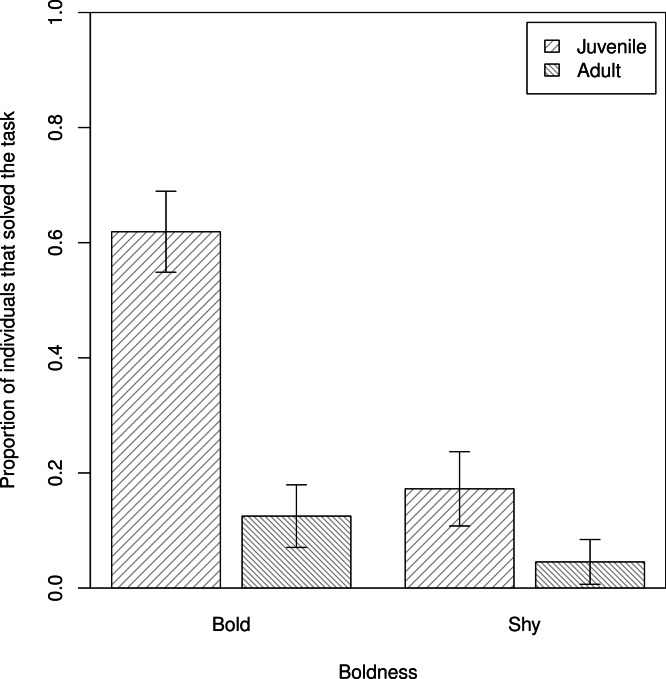
Figure 3. The proportions of individuals that solved the task.
Differences in proportions of adult and juvenile bold and shy baboons that ‘solved’ the hidden food task by obtaining and eating food from the box (n = 80). Plotted are the means and standard errors for the raw data; note that though the data are presented as categories (split at the mean of the trait for the population) they were analysed as continuous variables.

