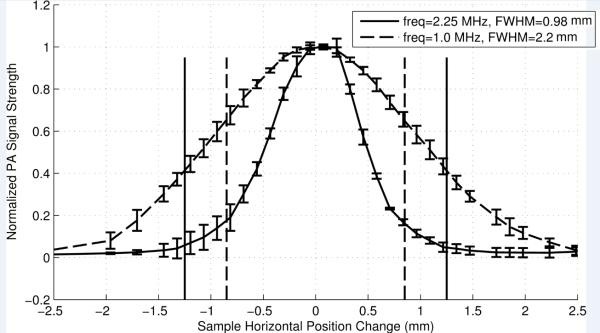
Fig. 4.

The normalized PA signal strength as a function of the horizontal position of the sample relative to the co-axis of the laser beam and the UST. The data were obtained with a 1 MHz (dashed curve) and a 2.25 MHz (solid curve) UST. The dashed vertical lines show the inner diameters and the solid vertical lines show the outer diameters of the phantom tube that is filled with 0.5 g/L ICG solution at a depth of 1.9 mm in a 1% intralipid solution. The diameter of the collimated laser beam is ~1.0 mm. The error bars represent the standard deviation of 4 measurements.
