
Fig. 7.


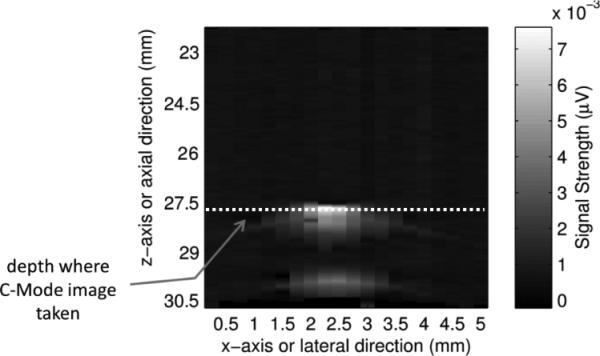
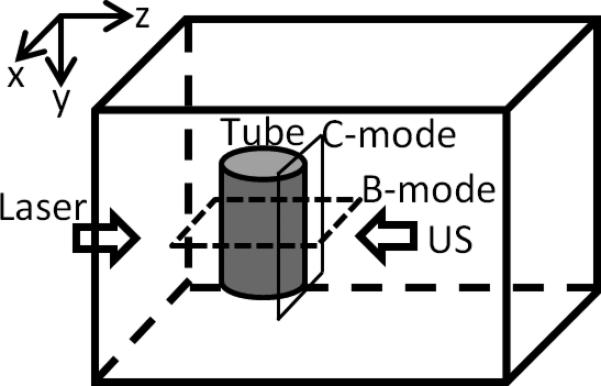
(a). A C-mode ultrasound image and (b) a C-mode PA image of the ICG filled tube. The UST frequency is 2.25 MHz, the ICG concentration is 2 g/L, and the intralipid concentration is 1%. (c). An ultrasound B-mode image showing the cross section of the same ICG filled tube. The white dotted line indicates the depth of the C-mode images in (a) and (b). Note that the depth of zero in this Figure is the surface of the UST, which is different from the definition of the tube depth). (d) A diagram to show the B-mode and C-mode imaging planes. The B-mode image is parallel to the x-z plane and the C-mode is parallel to the x-y plane (close to the right-side edge of the tube).