
Figure 3. Relative frequency of the uses of mathematics and association between categories.
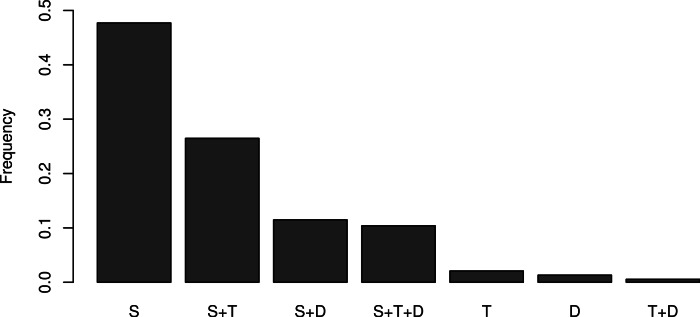
Most respondents use mathematics primarily for statistics (S), and some other for statistics+theory (S+T, 26%), and the remaining 11% for statistics+decision making (S+D) and 10% for statistics+theory+decision making (S+T+D). Pure theoreticians (T) are therefore negligible in the sample.