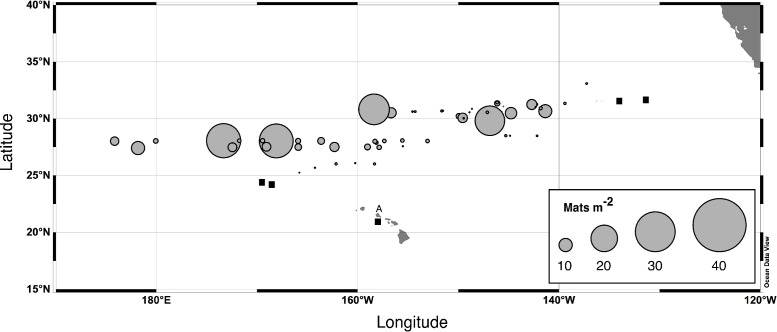
Figure 4. Rhizosolenia mat integrated abundance.
Diver-collected abundance in the upper 60 m. Data are from 6 cruises spanning 1992–2003 and literature sources (Alldredge & Silver, 1982; Martinez et al., 1983). Total number of stations, n = 96. Filled squares indicate stations where mats were observed but not quantified. The A is Sta. ALOHA of the Hawaiʻi Ocean Time-Series (HOT).

