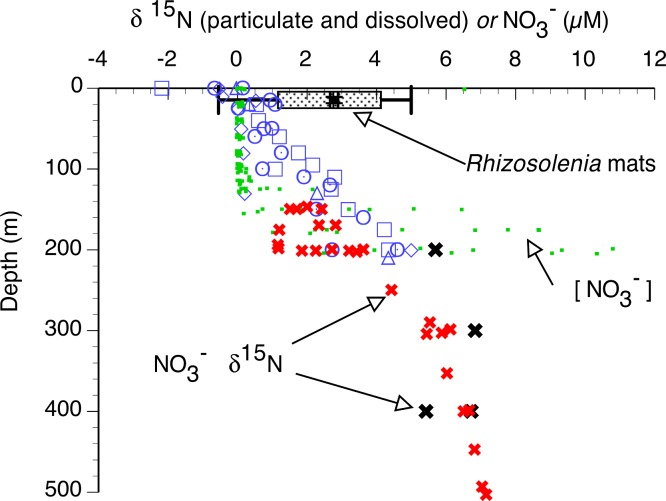
Figure 7. Particulate δ15N and nitrate δ15N of the sampled areas in the Pacific Ocean.
Suspended particulate data (open symbols) are from the 2002 cruise, pooled from Sta. 1 (22.197°N 157.960°W), 5 (28.008°N 158.019°W), 7 (28.000°N 153.736°W) and 10 (30.504°N 149.615°W). Rhizosolenia mat δ15N is averaged (box and whiskers) over all cruises (±95% C.I.). Open symbols are suspended particulate material δ15N, large solid symbols are dissolved NO3− δ15N, small filled squares are the dissolved NO3− concentration (2003 stations). Red “X” are from Casciotti et al. (2008) at Station ALOHA. Black “X” are from the 2002 stations.

