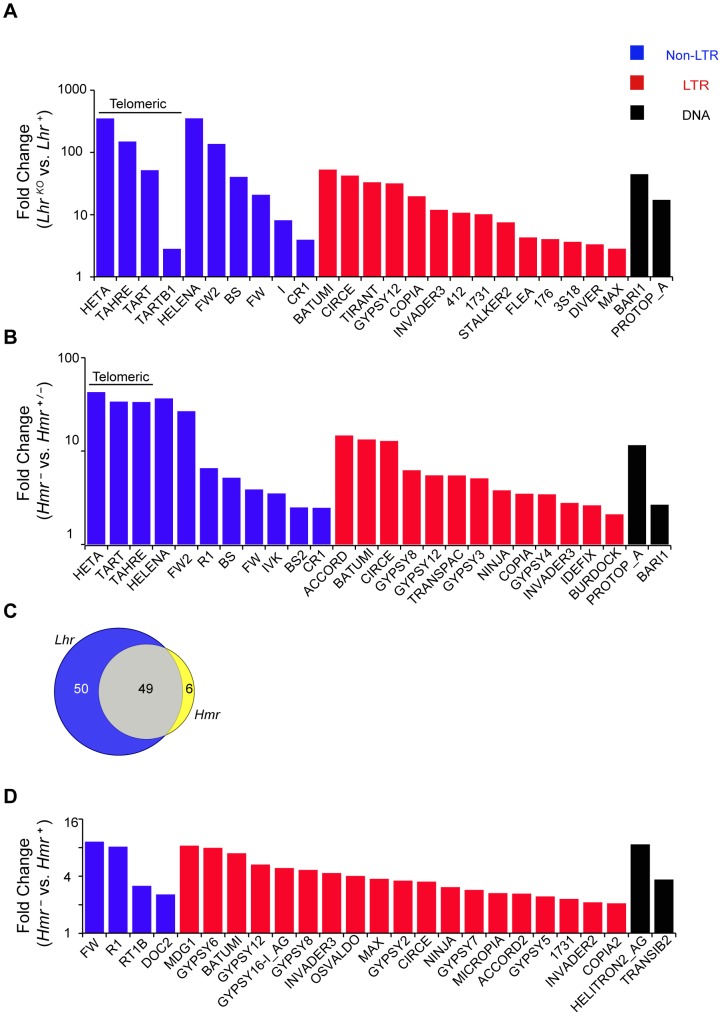
Figure 3. TE misregulation in Lhr and Hmr mutants.
(A and B) Analysis of LhrKO (A) and Hmr− (B) ovaries. Reads with zero mismatches were mapped separately to the individual-insertion or consensus-sequence TE databases. A subset of TEs that are significantly different between genotypes are shown and include those with the 25 lowest p-values obtained from individual-insertion mapping analysis, but excluding all centroid repeats [98]. Additionally shown are TAHRE, which is only found in the consensus-sequence database, as well as TARTB1 for LhrKO, which is significant but not among the 25 top hits in the LhrKO individual-insertion analysis. (C) 49 TEs are upregulated at least 2 fold in both LhrKO and Hmr−. TE families include those resulting from mapping reads to the insertion database, as well as families found only when reads were mapped to the consensus database. (D) Reads from Hmr mutant or wildtype male larvae with up to three mismatches were mapped to the individual-insertion or consensus-sequence TE databases. All TE families, excluding centroids, that were significantly upregulated in the insertion sequence based analysis are shown here. Note the different Y-axis scales in A, B and D. Classification of DNA, LTR and non-LTR elements is from reference [99].

