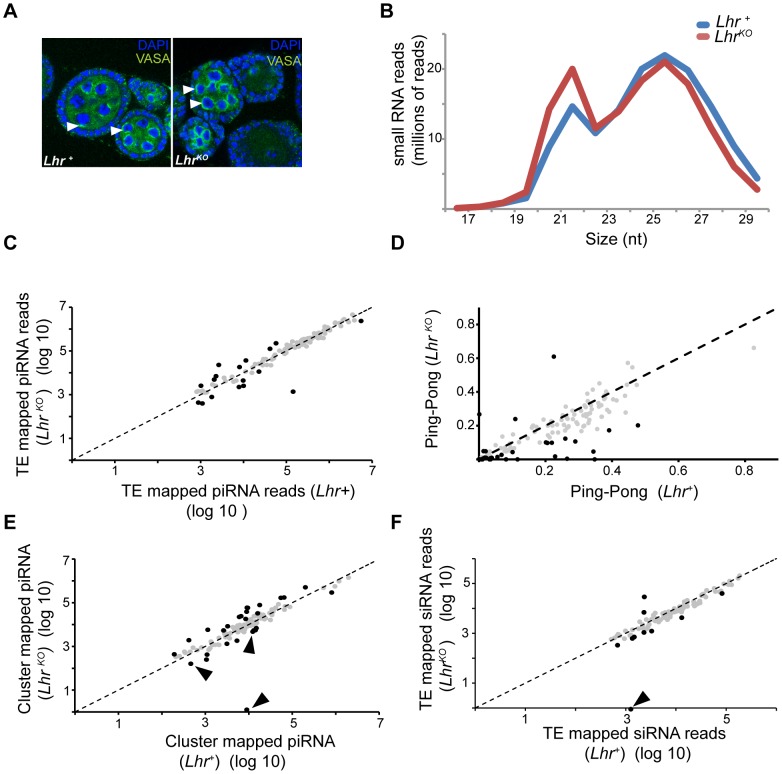
Figure 7. Small RNA patterns are largely unaffected in LhrKO.
(A) VASA (green) marks the peri-nuclear nuage (white arrowheads) and shows no difference in localization between Lhr+ and LhrKO ovaries. (B) siRNA (17–22 nt) without mismatches and piRNA (23–30 nt) with up to one mismatch were mapped to a reference sequence set containing the D. melanogaster r5.68 genome, D. melanogaster sequences from Repbase and the repeat-sequence database. The number of mapped LhrKO reads was normalized to the total number of mapped Lhr+ reads. (C) Filtered piRNA reads were mapped uniquely to the Repbase TE consensus sequences with one allowed mismatch. 121 TE families producing > = 1000 reads summed over both genotypes are shown. Black circles represent TE families whose fold change between LhrKO and Lhr+ is greater than 2 fold (p<0.001). (D) Ping-pong scores of TE families in LhrKO and Lhr+. Black circles represent TE families whose fold change in ping-pong score between LhrKO and Lhr+ is greater than 2 fold (Table S10). (E) Plot shows the number of unique piRNAs mapped to piRNA clusters, with one allowed mismatch and normalized between genotypes. piRNA clusters with > = 500 reads summed over both genotype are shown. Black arrowheads point to sub-telomeric piRNA clusters. Black circles indicate clusters whose fold change between LhrKO and Lhr+ is greater than 2-fold (p<0.001). (F) Unique siRNA (17–22 nt) were mapped as in (C), except no mismatches were allowed. 96 TE families are plotted that have > = 1000 reads summed over both genotypes. Black circles represent TEs whose siRNA levels changed by >2 fold. siRNA mapping to the TAS repeat HETRP are almost completely lost (arrow). For (C, D, F) significance values were calculated using F.E.T., implemented in DEG-seq.

