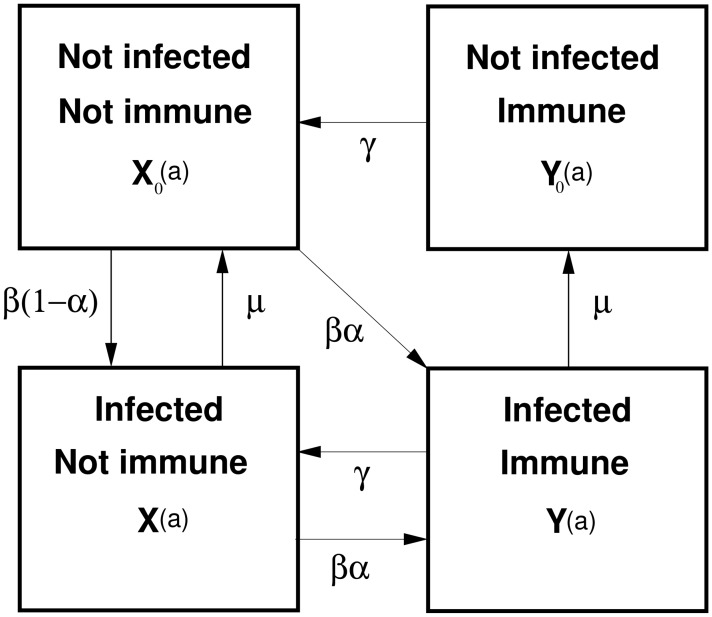
Figure 1. Transmission model for E.multilocularis in foxes.
State variables are:  ,
,  ,
,  and
and  , where
  represents the proportion of hosts (foxes) which are not infected and not immune at age
  , the other state variables are similarly defined. Parameter
  denotes the infection pressure (force of infection), measured in insults (exposures) per year;
  is the probability of immunity on exposure;
  is the rate of loss of host immunity;
  is the parasite death rate.

