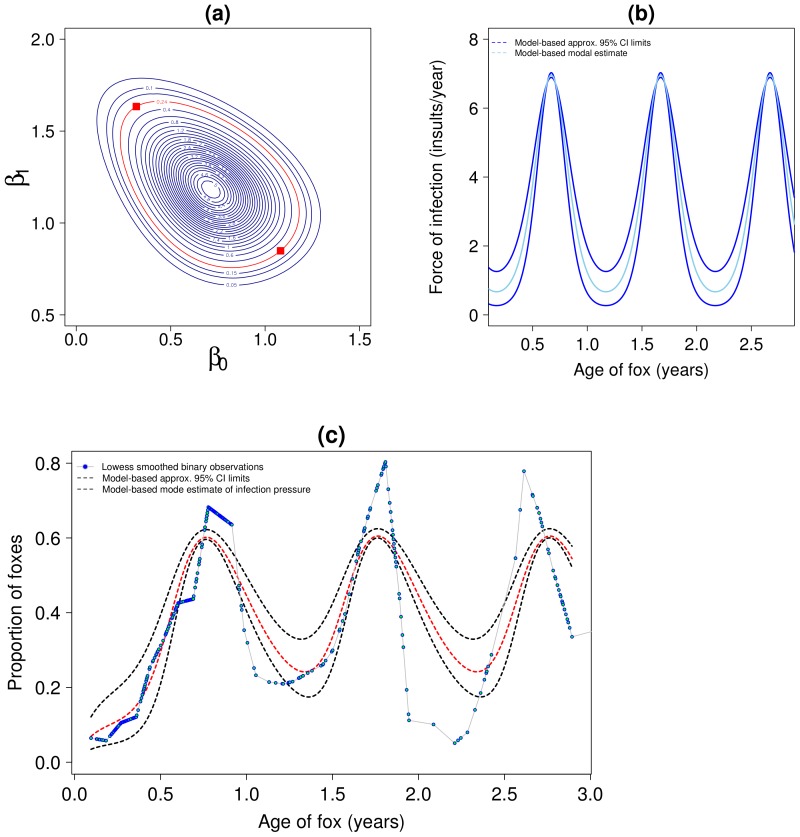
Figure 3. Transmission Model 1-P.
Panel (a): joint marginal posterior density for  on log scale. The red contour is the 95% limit and the two points marked are those used to produce approx. 95% confidence intervals in panels b and c. Panel (b): dynamics of force of infection by age, 95% CI is for the mean force of infection at age
  . Panel (c): Smoothed observed prevalence and prevalence predicted by Model 1-P, 95% CI are for the mean prevalence at age
  . All results use the informative prior for
  with mean = 1.2 and sd = 0.2.

