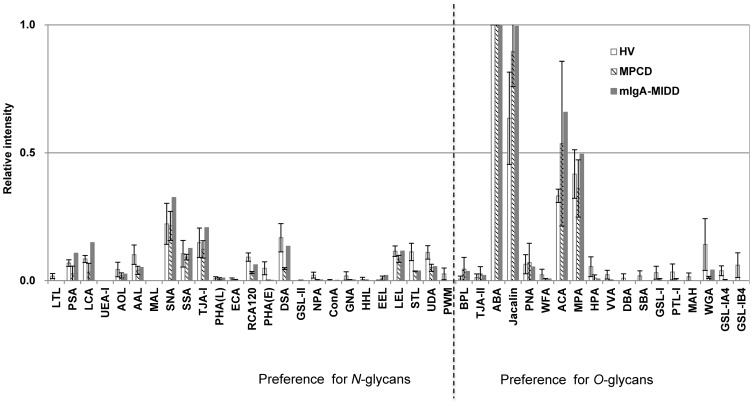
Figure 2. Differential glycan profiles of purified IgA1 after trypsin digestion.
IgA1 purified from sera of three HVs, two MPCD patients, and one mIgA-MIDD patient was incubated with trypsin. Each tryptic digest was labeled with Cy3-SE and subjected to the lectin microarray. The relative intensities of lectins were normalized to the maximum fluorescence intensity.

